ClusterKinG
The ClusterKinG package provides a flexible yet easy to use framework to cluster sets of histograms (or similar datasets) and to select benchmark points representing each cluster. The package particularly focuses on use cases in high energy physics.
Readme
Description
This package provides a flexible yet easy to use framework to cluster sets of histograms (or other higher dimensional data) and to select benchmark points representing each cluster. The package particularly focuses on use cases in high energy physics.
A physics use case has been demonstrated in https://arxiv.org/abs/1909.11088.
Physics Case
While most of this package is very general and can be applied to a broad variety of use cases, we have been focusing on applications in high energy physics (particle physics) so far and provide additional convenience methods for this use case. In particular, most of the current tutorials are in this context.
Though very successful, the Standard Model of Particle Physics is believed to be uncomplete, prompting the search for New Physics (NP). The phenomenology of NP models typically depends on a number of free parameters, sometimes strongly influencing the shape of distributions of kinematic variables. Besides being an obvious challenge when presenting exclusion limits on such models, this also is an issue for experimental analyses that need to make assumptions on kinematic distributions in order to extract features of interest, but still want to publish their results in a very general way.
By clustering the NP parameter space based on a metric that quantifies the similarity of the resulting kinematic distributions, a small number of NP benchmark points can be chosen in such a way that they can together represent the whole parameter space. Experiments (and theorists) can then report exclusion limits and measurements for these benchmark points without sacrificing generality.
Installation
clusterking can be installed/upgraded with the python package installer:
pip3 install --user --upgrade "clusterking[plotting]"
If you do not require plotting, you can remove [plotting].
More options and troubleshooting advice is given in the documentation.
Caveats
- Version 1.0.0 contained several mistakes in the chi2 metric. Please make sure that you are at least using versoin 1.1.0. These mistakes were also found in the paper and will be fixed soon.
Usage and Documentation
Good starting point: Jupyter notebooks in the examples/jupyter_notebook directory.
You can also try running them online right now (without any installation required) using
binder (just note that this is somewhat unstable, slow and takes some time
to start up).
For a documentation of the classes and functions in this package, read the docs on readthedocs.io.
For additional examples, presentations and more, you can also head to our other repositories.
Example
Sample
The following code (taken from examples/jupyter_notebook/010_basic_tutorial.ipynb) is all that
is needed to cluster the shape of the q^2 distribution of B -> D tau nu
in the space of Wilson coefficients:
import flavio
import numpy as np
import clusterking as ck
s = ck.scan.WilsonScanner(scale=5, eft='WET', basis='flavio')
# Set up kinematic function
def dBrdq2(w, q):
return flavio.np_prediction("dBR/dq2(B+->Dtaunu)", w, q)
s.set_dfunction(
dBrdq2,
binning=np.linspace(3.2, 11.6, 10),
normalize=True
)
# Set sampling points in Wilson space
s.set_spoints_equidist({
"CVL_bctaunutau": (-1, 1, 10),
"CSL_bctaunutau": (-1, 1, 10),
"CT_bctaunutau": (-1, 1, 10)
})
# Create data object to write to and run
d = ck.DataWithErrors()
r = s.run(d)
r.write() # Write results back to data object
Cluster
Using hierarchical clustering:
c = ck.cluster.HierarchyCluster() # Initialize worker class
c.set_metric("euclidean")
c.set_max_d(0.15) # "Cut off" value for hierarchy
r = c.run(d) # Run clustering on d
r.write() # Write results to d
Benchmark points
b = ck.Benchmark() # Initialize worker class
b.set_metric("euclidean")
r = b.run(d) # Select benchmark points based on metric
r.write() # Write results back to d
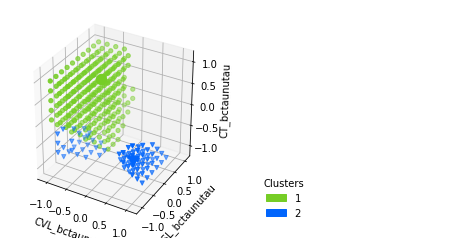
Plotting
d.plot_clusters_scatter(
['CVL_bctaunutau', 'CSL_bctaunutau', 'CT_bctaunutau'],
clusters=[1,2] # Only plot 2 clusters for better visibility
)
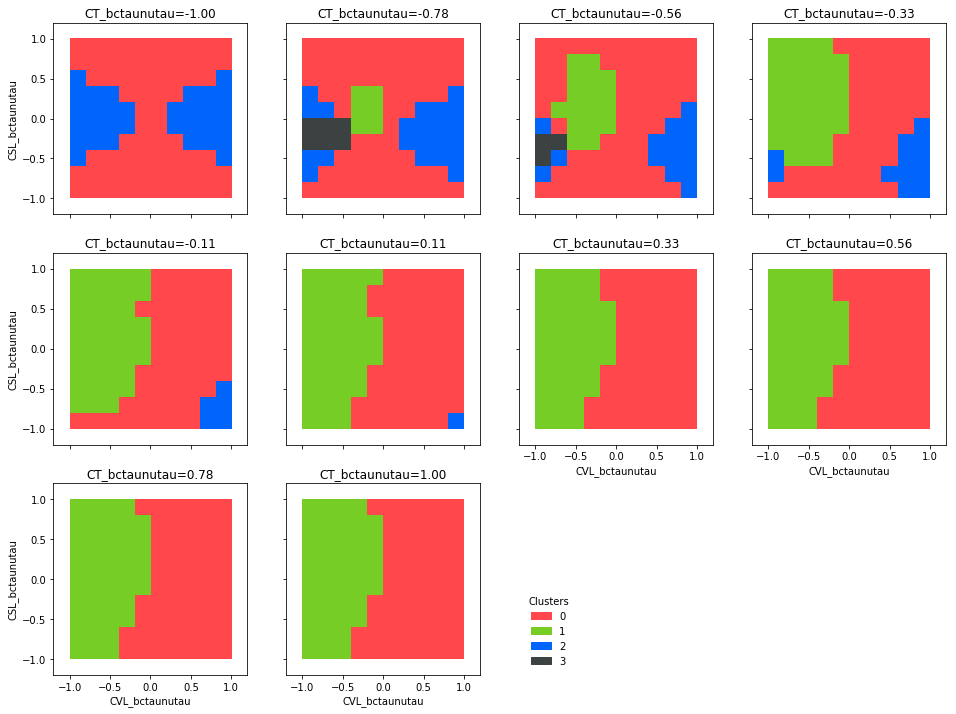
d.plot_clusters_fill(['CVL_bctaunutau', 'CSL_bctaunutau'])
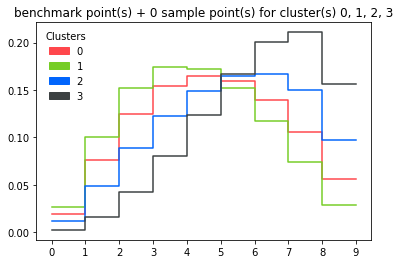
Plotting all benchmark points:
d.plot_dist()
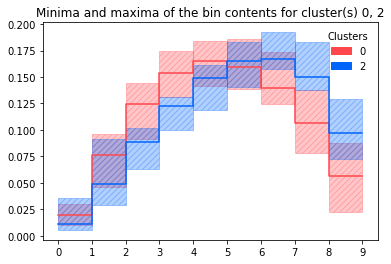
Plotting minima and maxima of bin contents for all histograms in a cluster (+benchmark histogram):
d.plot_dist_minmax(clusters=[0, 2])
Similarly with box plots:
d.plot_dist_box()
License & Contributing
This project is ongoing work and questions, comments, bug reports or pull requests are most welcome. You can also use the chat room on gitter or contact us via email. We are also working on a paper, so please make sure to cite us once we publish.
This software is licenced under the MIT license.
Installation
Basic installation:
pip3 install --user --upgrade "clusterking[,plotting]"
If you do not require plotting, you can remove [,plotting], which adds
matplotlib as a dependency.
If you are on MaxOS, you might want to check out the
matplotlib documentation
on how to install matplotlib and install it prior to installing matplotlib.
Development
Software
Please install the ClusterKinG package with the development packages from the latest master version on github:
git clone https://github.com/clusterking/clusterking
cd clusterking
pip3 install --editable --user ".[plotting,dev]"
This will enable you to run our unittests, build the documentation and more.
Git hooks
Please install our git pre-commit hooks:
pip3 install --user pre-commit
pre-commit install
Now, every time you commit to this package, a number of checks and cleanups are performed, among them
- Code styling with black
- Stripping output of jupyter notebooks with nbstripout
Git commit message
It’s recommended to use the following prefixes:
[Fix]: Fixing a bug[Int]: Interface change[Feat]: New feature[Doc]: Everything regarding documentation[CI]: Continuus Integration (unittests and more)[Ref]: Code refactoring[Clean]: Code cleanup (style improvement etc.)[Deploy]: Everything that has to do with releases[Dev]: Things that are only relevant to developers
this helps to get an overview over what’s happening, e.g. when compiling release notes.
Data
This page describes the main data object that are used by ClusterKinG.
If you do not need to include errors in your analysis, use
Data, else
DataWithErrors (which inherits from
Data but adds additional methods to it).
Both classes inherit from a very basic class,
DFMD, which provides basic input and output
methods.
DFMD
- class
clusterking.data.DFMD(path: Union[str, pathlib.PurePath, None] = None, log: Union[str, logging.Logger, None] = None)[source]¶Bases:
objectDFMD = DataFrame with MetaData. This class bundles a pandas dataframe together with metadata and provides methods to save and load such an object.
__init__(path: Union[str, pathlib.PurePath, None] = None, log: Union[str, logging.Logger, None] = None)[source]¶Initialize a DFMD object.
Parameters:
- path – Optional: load from this file (specified as string or
pathlib.PurePath)- log – Optional: instance of
logging.Loggeror name of logger to be created
md= None¶This will hold all the configuration that we will write out
df= None
pandas.DataFrameto hold all of the results
log= None¶Instance of
logging.Logger
write(path: Union[str, pathlib.PurePath], overwrite='ask')[source]¶Write output files.
Parameters:
- path – Path to output file
- overwrite – How to proceed if output file already exists: ‘ask’ (ask interactively for approval if we have to overwrite), ‘overwrite’ (overwrite without asking), ‘raise’ (raise Exception if file exists). Default is ‘ask’.
Returns: None
Data
- class
clusterking.data.Data(*args, **kwargs)[source]¶Bases:
clusterking.data.dfmd.DFMDThis class inherits from the
DFMDclass and adds additional methods to it. It is the basic container, that contains
- The distributions to cluster
- The cluster numbers after clustering
- The benchmark points after they are selected.
bin_cols¶All columns that correspond to the bins of the distribution. This is automatically read from the metadata as set in e.g.
clusterking.scan.Scanner.run().
par_cols¶All columns that correspond to the parameters (e.g. Wilson parameters). This is automatically read from the metadata as set in e.g. the
clusterking.scan.Scanner.run().
n¶Number of points in parameter space that were sampled.
nbins¶Number of bins of the distribution.
npars¶Number of parameters that were sampled (i.e. number of dimensions of the sampled parameter space.
data(normalize=False) → numpy.ndarray[source]¶Returns all histograms as a large matrix.
Parameters: normalize – Normalize all histograms Returns: numpy.ndarray of shape self.n x self.nbins
norms() → numpy.ndarray[source]¶Returns a vector of all normalizations of all histograms (where each histogram corresponds to one sampled point in parameter space).
Returns: numpy.ndarray of shape self.n
clusters(cluster_column='cluster') → List[Any][source]¶Return list of all cluster names (unique)
Parameters: cluster_column – Column that contains the cluster names
get_param_values(param: Union[None, str] = None)[source]¶Return all unique values of this parameter
Parameters: param – Name of parameter. If none is given, instead return a dictionary mapping of parameters to their values. Returns:
only_bpoints(bpoint_column='bpoint', inplace=False)[source]¶Keep only the benchmark points as sample points.
Parameters:
- bpoint_column – benchmark point column (boolean)
- inplace – If True, the current Data object is modified, if False, a new copy of the Data object is returned.
Returns: None or Data
fix_param(inplace=False, bpoints=False, bpoint_slices=False, bpoint_column='bpoint', **kwargs)[source]¶Fix some parameter values to get a subset of sample points.
Parameters:
- inplace – Modify this Data object instead of returning a new one
- bpoints – Keep bpoints (no matter if they are selected by the other selection or not)
- bpoint_slices – Keep all parameter values that are attained by benchmark points.
- bpoint_column – Column with benchmark points (default ‘bpoints’) (for use with the
bpointsoption)- **kwargs – Specify parameter values: Use
<parameter name>=<value>or<parameter name>=[<value1>, ..., <valuen>].Returns: If
inplace == False, return new Data with subset of sample points.Examples:
d = Data("/path/to/tutorial/csv/folder", "tutorial_basics")Return a new Data object, keeping the two values
CT_bctaunutauclosest to -0.75 or 0.5d.fix_param(CT_bctaunutau=[-.75, 0.5])Return a new Data object, where we also fix
CSL_bctaunutauto the value closest to -1.0:d.fix_param(CT_bctaunutau=[-.75, 0.5], CSL_bctaunutau=-1.0)Return a new Data object, keeping the two values
CT_bctaunutauclosest to -0.75 or 0.5, but make sure we do not discard any benchmark points in that process:d.fix_param(CT_bctaunutau=[-.75, 0.5], bpoints=True)Return a new Data object, keeping the two values
CT_bctaunutauclosest to -0.75 or 0.5, but keep all values ofCT_bctaunutauthat are attained by at least one benchmark point:d.fix_param(CT_bctaunutau=[-.75, 0.5], bpoint_slices=True)Return a new Data object, keeping only those values of
CT_bctaunutau, that are attained by at least one benchmark point:d.fix_param(CT_bctaunutau=[], bpoint_slice=True)
sample_param(bpoints=False, bpoint_slices=False, bpoint_column='bpoint', inplace=False, **kwargs)[source]¶Return a Data object that contains a subset of the sample points (points in parameter space). Similar to Data.fix_param.
Parameters:
- inplace – Modify this Data object instead of returning a new one
- bpoints – Keep bpoints (no matter if they are selected by the other selection or not)
- bpoint_slices – Keep all parameter values that are attained by benchmark points
- bpoint_column – Column with benchmark points (default ‘bpoints’) (for use with the
bpointsoption)- **kwargs – Specify parameter ranges:
<coeff name>=(min, max, npoints)or<coeff name>=npointsFor each coeff (identified by <coeff name>), select (at most) npoints points between min and max. In total this will therefore result in npoints_{coeff_1} x … x npoints_{coeff_npar} sample points (provided that there are enough sample points available). If a coefficient isn’t contained in the dictionary, this dimension of the sample remains untouched.Returns: If
inplace == False, return new Data with subset of sample points.Examples:
d = Data("/path/to/tutorial/csv/folder", "tutorial_basics")Return a new Data object, keeping subsampling
CT_bctaunutauclosest to 5 values between -1 and 1:d.sample_param(CT_bctaunutau=(-1, 1, 10))The same in shorter syntax (because -1 and 1 are the minimum and maximum of the parameter)
d.sample_param(CT_bctaunutau=10)For the
bpointsandbpoint_slicessyntax, see the documenation ofclusterking.data.Data.fix_param().
sample_param_random(inplace=False, bpoints=False, bpoint_column='bpoint', **kwargs)[source]¶Random subsampling in parameter space.
Parameters:
- inplace – Modify this Data object instead of returning a new one
- bpoints – Keep bpoints (no matter if they are selected by the other selection or not)
- bpoint_column – Column with benchmark points (default ‘bpoints’) (for use with the
bpointsoption)- **kwargs – Arguments for
pandas.DataFrame.sample()Returns: If
inplace == False, return new Data with subset of sample points.
find_closest_spoints(point: Dict[str, float], n=10) → clusterking.data.data.Data[source]¶Given a point in parameter space, find the closest sampling points to it and return them as a
Dataobject with the corresponding subset of spoints. The order of the rows in the dataframeData.dfwill be in order of increasing parameter space distance from the given point.
Parameters:
- point – Dictionary of parameter name to value
- n – Maximal number of rows to return
Returns:
Dataobject with subset of rows of dataframe corresponding to the closest points in parameter space.
find_closest_bpoints(point: Dict[str, float], n=10, bpoint_column='bpoint')[source]¶Given a point in parameter space, find the closest benchmark points to it and return them as a
Dataobject with the corresponding subset of benchmark points. The order of the rows in the dataframeData.dfwill be in order of increasing parameter space distance from the given point.
Parameters:
- point – Dictionary of parameter name to value
- n – Maximal number of rows to return
- bpoint_column – Column name of the benchmark column
Returns:
Dataobject with subset of rows of dataframe corresponding to the closest points in parameter space.
configure_variable(variable, axis_label=None)[source]¶Set additional information for variables, e.g. the variable on the x axis of the plots of the distribution or the parameters.
Parameters:
- variable – Name of the variable
- axis_label – An alternate name which will be used on the axes of plots.
rename_clusters(arg=None, column='cluster', new_column=None)[source]¶Rename clusters based on either
- A dictionary of the form
{<old cluster name>: <new cluster name>}- A function that maps the old cluster name to the new cluster name
Example for 2: Say our
Dataobjectdcontains clusters 1 to 10 in the default columncluster. The following method call will instead use the numbers 0 to 9:d.rename_clusters(lambda x: x-1)
Parameters:
- arg – Dictionary or function as described above.
- column – Column that contains the cluster names
- new_column – New column to write to (default None, i.e. rename in place)
Returns: None
plot_dist(cluster_column='cluster', bpoint_column='bpoint', title: Optional[str] = None, clusters: Optional[List[int]] = None, nlines=None, bpoints=True, legend=True, ax=None, hist_kwargs: Optional[Dict[str, Any]] = None, hist_kwargs_bp: Optional[Dict[str, Any]] = None)[source]¶Plot several examples of distributions for each cluster specified.
Parameters:
- cluster_column – Column with the cluster names (default ‘cluster’)
- bpoint_column – Column with bpoints (default ‘bpoint’)
- title – Plot title (
None: automatic)- clusters – List of clusters to selected or single cluster. If None (default), all clusters are chosen.
- nlines – Number of example distributions of each cluster to be plotted (default 0)
- bpoints – Draw benchmark points (default True)
- legend – Draw legend? (default True)
- ax – Instance of matplotlib.axes.Axes to plot on. If None, a new one is instantiated.
- hist_kwargs – Keyword arguments passed on to
plot_histogram()- hist_kwargs_bp – Like
hist_kwargsbut used for benchmark points. IfNone,hist_kwargsis used.Note: To customize these kind of plots further, check the
BundlePlotclass and theplot_bundles()method thereof.
Returns: Figure
plot_dist_minmax(cluster_column='cluster', bpoint_column='bpoint', title: Optional[str] = None, clusters: Optional[List[int]] = None, bpoints=True, legend=True, ax=None, hist_kwargs: Optional[Dict[str, Any]] = None, fill_kwargs: Optional[Dict[str, Any]] = None)[source]¶Plot the minimum and maximum of each bin for the specified clusters.
Parameters:
- cluster_column – Column with the cluster names (default ‘cluster’)
- bpoint_column – Column with bpoints (default ‘bpoint’)
- title – Plot title (
None: automatic)- clusters – List of clusters to selected or single cluster. If None (default), all clusters are chosen.
- bpoints – Draw benchmark points (default True)
- legend – Draw legend? (default True)
- ax – Instance of matplotlib.axes.Axes to plot on. If None, a new one is instantiated.
- hist_kwargs – Keyword arguments to
plot_histogram()- fill_kwargs – Keyword arguments to`matplotlib.pyplot.fill_between`
Note: To customize these kind of plots further, check the
BundlePlotclass and theplot_minmax()method thereof.
Returns: Figure
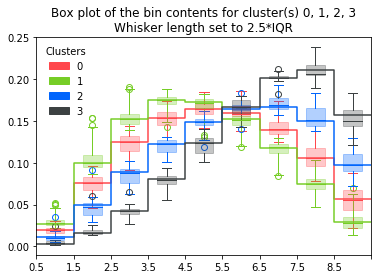
plot_dist_box(cluster_column='cluster', bpoint_column='bpoint', title: Optional[str] = None, clusters: Optional[List[int]] = None, bpoints=True, whiskers=2.5, legend=True, ax=None, boxplot_kwargs: Optional[Dict[str, Any]] = None, hist_kwargs: Optional[Dict[str, Any]] = None)[source]¶Box plot of the bin contents of the distributions corresponding to selected clusters.
Parameters:
- cluster_column – Column with the cluster names (default ‘cluster’)
- bpoint_column – Column with bpoints (default ‘bpoint’)
- title – Plot title (
None: automatic)- clusters – List of clusters to selected or single cluster. If None (default), all clusters are chosen.
- bpoints – Draw benchmark points (default True)
- whiskers – Length of the whiskers of the box plot in units of IQR (interquartile range, containing 50% of all values). Default 2.5.
- legend – Draw legend? (default True)
- boxplot_kwargs – Arguments to matplotlib.pyplot.boxplot
- ax – Instance of matplotlib.axes.Axes to plot on. If None, a new one is instantiated.
- boxplot_kwargs – Keyword arguments to matplotlib.pyplot.boxplot
- hist_kwargs – Keyword arguments to
plot_histogram()Note: To customize these kind of plots further, check the
BundlePlotclass and thebox_plot()method thereof.
Returns: Figure
plot_clusters_scatter(params=None, clusters=None, cluster_column='cluster', bpoint_column='bpoint', legend=True, max_subplots=16, max_cols=4, markers=('o', 'v', '^', 'v', '<', '>'), figsize=4, aspect_ratio=None)[source]¶Create scatter plot, specifying the columns to be on the axes of the plot. If 3 column are specified, 3D scatter plots are presented, else 2D plots. If the dataframe contains more columns, such that each row is not only specified by the columns on the axes, a selection of subplots is created, showing ‘cuts’. Benchmark points are marked by enlarged plot markers.
Parameters:
- params – The names of the columns to be shown on the x, (y, (z)) axis of the plots.
- clusters – The get_clusters to be plotted (default: all)
- cluster_column – Column with the cluster names (default ‘cluster’)
- bpoint_column – Column with bpoints (default ‘bpoint’)
- legend – Draw legend? (default True)
- max_subplots – Maximal number of subplots
- max_cols – Maximal number of columns of the subplot grid
- markers – List of markers of the get_clusters
- figsize – Base size of each subplot
- aspect_ratio – Aspect ratio of 2D plots. If None, will be chosen automatically based on data ranges.
Returns: Figure
plot_clusters_fill(params=None, cluster_column='cluster', bpoint_column='bpoint', legend=True, max_subplots=16, max_cols=4, figsize=4, aspect_ratio=None)[source]¶Call this method with two column names, x and y. The results are similar to those of 2D scatter plots as created by the scatter method, except that the coloring is expanded to the whole xy plane. Note: This method only works with uniformly sampled NP!
Parameters:
- params – The names of the columns to be shown on the x, y (and z) axis of the plots.
- cluster_column – Column with the cluster names (default ‘cluster’)
- bpoint_column – Column with bpoints (default ‘bpoint’)
- legend – Draw legend? (default True)
- max_subplots – Maximal number of subplots
- max_cols – Maximal number of columns of the subplot grid
- figsize – Base size of each subplot
- aspect_ratio – Aspect ratio of 2D plots. If None, will be chosen automatically based on data ranges.
Returns: Figure
plot_bpoint_distance_matrix(cluster_column='cluster', bpoint_column='bpoint', metric='euclidean', ax=None)[source]¶Plot the pairwise distances of all benchmark points.
Parameters:
- cluster_column – Column with the cluster names (default ‘cluster’)
- bpoint_column – Column with bpoints (default ‘bpoint’)
- metric – String or function. See
clusterking.maths.metric.metric_selection(). Default: Euclidean distance.- ax – Matplotlib axes or None (automatic)
Returns: Figure
DataWithErrors
- class
clusterking.data.DataWithErrors(*args, **kwargs)[source]¶Bases:
clusterking.data.data.DataThis class extends the
Dataclass by convenient and performant ways to add errors to the distributions.See the description of the
Dataclass for more information about the data structure itself.There are three basic ways to add errors:
- Add relative errors (with correlation) relative to the bin content of each bin in the distribution:
add_rel_err_...(\(\mathrm{Cov}^{(k)}_{\text{rel}}(i, j)\))- Add absolute errors (with correlation):
add_err_...(\(\mathrm{Cov}^{(k)}_{\text{abs}}(i, j)\))- Add poisson errors:
add_err_poisson()The covariance matrix for bin i and j of distribution n (with contents \(d^{(n)}_i\)) will then be
\[\begin{split}\mathrm{Cov}(d^{(n)}_i, d^{(n)}_j) = &\sum_{k}\mathrm{Cov}_{\text{rel}}^{(k)}(i, j) \cdot d^{(n)}_i d^{(n)}_j + \\ + &\sum_k\mathrm{Cov}_{\text{abs}}^{(k)}(i, j) + \\ + &\delta_{ij} \sqrt{d^{(n)}_i d^{(n)}_j} / \sqrt{s}\end{split}\]Note
All of these methods add the errors in a consistent way for all sample points/distributions, i.e. it is impossible to add a certain error specifically to one sample point only!
Afterwards, you can get errors, correlation and covariance matrices for every data point by using one of the methods such as
cov(),corr(),err().Note
When saving your dataset, your error configuration is saved as well, so you can reload it like any other
DataorDFMDobject.
Parameters: data – n x nbins matrix
rel_cov¶Relative covariance matrix that will be later applied to the data (see class documentation).
\[\mathrm{Cov}_{\text{rel}}(i, j) = \sum_k\mathrm{Cov}_{\text{rel}}^{(k)}(i, j)\]If no errors have been added, this is defined to be a zero matrix.
Returns: self.nbins * self.nbinsmatrix
abs_cov¶Absolute covariance matrix that will be later applied to the data (see class documentation).
\[\mathrm{Cov}_{\text{abs}}(i, j) = \sum_k\mathrm{Cov}_{\text{abs}}^{(k)}(i, j)\]If no errors have been added, this is defined to be a zero matrix.
Returns: self.nbins * self.nbinsmatrix
poisson_errors¶Should poisson errors be added?
poisson_errors_scale¶Scale poisson errors. See documentation of
add_err_poisson().
cov(relative=False) → numpy.ndarray[source]¶Return covariance matrix \(\mathrm{Cov}(d^{(n)}_i, d^{(n)}_j)\)
If no errors have been added, a zero matrix is returned.
Parameters: relative – “Relative to data”, i.e. \(\mathrm{Cov}(d^{(n)}_i, d^{(n)}_j) / (d^{(n)}_i \cdot d^{(n)}_j)\) Returns: self.n x self.nbins x self.nbinsarray
corr() → numpy.ndarray[source]¶Return correlation matrix. If covariance matrix is empty (because no errors have been added), a unit matrix is returned.
Returns: self.n x self.nbins x self.nbinsarray
err(relative=False) → numpy.ndarray[source]¶Return errors per bin, i.e. \(e_i^{(n)} = \sqrt{\mathrm{Cov}(d^{(n)}_i, d^{(n)}_i)}\)
Parameters: relative – Relative errors, i.e. \(e_i^{(n)}/d_i^{(n)}\) Returns: self.n x self.nbinsarray
add_err_cov(cov) → None[source]¶Add error from covariance matrix.
Parameters: cov – self.n x self.nbins x self.nbinsarray of covariance matrices or self.nbins x self.nbins covariance matrix (if equal for all data points)
add_err_corr(err, corr) → None[source]¶Add error from errors vector and correlation matrix.
Parameters:
- err –
self.n x self.nbinsvector of errors for each data point and bin or self.nbins vector of uniform errors per data point or float (uniform error per bin and datapoint)- corr –
self.n x self.nbins x self.nbinscorrelation matrices orself.nbins x self.nbinscorrelation matrix
add_err_uncorr(err) → None[source]¶Add uncorrelated error.
Parameters: err – see argument of add_err_corr()
add_err_maxcorr(err) → None[source]¶Add maximally correlated error.
Parameters: err – see argument of add_err_corr()
add_rel_err_cov(cov) → None[source]¶Add error from “relative” covariance matrix
Parameters: cov – see argument of add_err_cov()
add_rel_err_corr(err, corr) → None[source]¶Add error from relative errors and correlation matrix.
Parameters:
- err – see argument of
add_err_corr()- corr – see argument of
add_err_corr()
add_rel_err_uncorr(err) → None[source]¶Add uncorrelated relative error.
Parameters: err – see argument of add_err_corr()
add_rel_err_maxcorr(err) → None[source]¶Add maximally correlated relative error.
Parameters: err – see argument of add_err_corr()
add_err_poisson(normalization_scale=1) → None[source]¶Add poisson errors/statistical errors.
Parameters: normalization_scale – Apply poisson errors corresponding to data normalization scaled up by this factor. For example, if your data is normalized to 1 and you still want to apply Poisson errors that correspond to a yield of 200, you can call add_err_poisson(200). Your data will stay normalized, but the poisson errors are appropriate for a total yield of 200.Returns: None
plot_dist_err(cluster_column='cluster', bpoint_column='bpoint', title: Optional[str] = None, clusters: Optional[List[int]] = None, bpoints=True, legend=True, hist_kwargs: Optional[Dict[str, Any]] = None, hist_fill_kwargs: Optional[Dict[str, Any]] = None, ax=None)[source]¶Plot distribution with errors.
Parameters:
- cluster_column – Column with the cluster names (default ‘cluster’)
- bpoint_column – Column with bpoints (default ‘bpoint’)
- title – Plot title (
None: automatic)- clusters – List of clusters to selected or single cluster. If
None(default), all clusters are chosen.- bpoints – Draw benchmark points if available (default True). If false or not benchmark points are available, pick a random sample point for each cluster.
- legend – Draw legend? (default True)
- hist_kwargs – Keyword arguments to
plot_histogram()- hist_fill_kwargs – Keyword arguments to
plot_histogram_fill()- ax – Instance of matplotlib.axes.Axes to plot on. If
None, a new one is instantiated.Note: To customize these kind of plots further, check the
BundlePlotclass and theerr_plot()method thereof.
Returns: Figure
Workers and Results
Operations on the data (represented by a Data object) are
performed by worker classes, which are a subclass of the
DataWorker class.
Usually the workflow looks as follows:
- Initialize the worker class
w = Worker() - Configure the worker class by applying a set of methods:
w.set_metric(...),w.configure_fom(...)`etc. - Run the worker class on a
Dataobject:r = w.run(d). This returns a result objectr.
Running a worker class returns a result class, which is formally a subclass of the
AbstractResult` class.
Most prominently, it has a write method, that allows to writes the relevant
part of the results back to the Data object. Thus the
workflow continues as
- Write back to data object:
r.write().
Worker
- class
clusterking.worker.AbstractWorker[source]¶Bases:
abc.ABCThe AbstractWorker class represents an abstract operation on some data.
It provides a number of methods to allow for configuration.
After configuration,
run()can be called.The underlying design patterns of this class are therefore the template method pattern and the command pattern.
- class
clusterking.worker.DataWorker[source]¶Bases:
clusterking.worker.AbstractWorkerThe worker class represents an operation on some data.
It provides a number of methods to allow for configuration.
After configuration,
run()can be called.The underlying design patterns of this class are therefore the template method pattern and the command pattern.
Result
- class
clusterking.result.DataResult(data: clusterking.data.data.Data)[source]¶Bases:
clusterking.result.AbstractResultThe result object represents the result of the execution of a
Workerobject on theDataobject.
Scan
This module generates a parameter dependent distributions for a selection
of sample points (points in parameter space), called spoints throughout
the code.
Two classes are defined:
Scanner: A general class, set up with a function (specified inset_dfunction()) that depends on points in parameter space and a set of sample points in this parameter space (specified via one of theset_spoints_...methods). The function is then run for every sample point and the results are written to aData-like object.WilsonScanner: This is a subclass ofScannerthat takes a wilson coefficient in the form of awilson.Wilsonobject as first argument.
Scanner
- class
clusterking.scan.Scanner[source]¶Bases:
clusterking.worker.DataWorkerThis class is set up with a function (specified in
set_dfunction()) that depends on points in parameter space and a set of sample points in this parameter space (specified via one of theset_spoints_...methods). The function is then run for every sample point (in therun()method) and the results are written to aData-like object.Usage example:
import clusterking as ck def myfunction(parameters, x): return sum(parameters) * x # Initialize Scanner class s = ck.scan.Scanner() # Set the function s.set_dfunction(myfunction) # Set the sample points s.set_spoints_equidist({ "a": (-1, 1, 10), "b": (-1, 1, 10) }) # Initialize a Data class to write to: d = ck.data.Data() # Run it r = s.run(d) # Write back results to data r.write()
__init__()[source]¶Initializes the
clusterking.scan.Scannerclass.
imaginary_prefix¶Prefix for the name of imaginary parts of coefficients. Also see e.g.
set_spoints_equidist(). Read only.
spoints¶Points in parameter space that are sampled (read-only).
coeffs¶The name of the parameters/coefficients/dimensions of the spoints (read only). Set after spoints are set. Does not include the names of the columns of the imaginary parts.
set_progress_bar(show: bool, **kwargs) → None[source]¶Settings for progress bar
Parameters:
- show – Show progress bar?
- **kwargs – Keyword arguments for tqdm progress bar
Returns:
set_dfunction(func: Callable, binning: Optional[collections.abc.Sized] = None, sampling: Optional[collections.abc.Sized] = None, normalize=False, xvar='xvar', yvar='yvar', **kwargs)[source]¶Set the function that generates the distributions that are later clustered (e.g. a differential cross section).
Parameters:
- func – A function that takes the point in parameter space as the first argument (Note: The parameters are given in alphabetically order with respect to the parameter name!). It should either return a
floator anp.ndarray. If thebinningorsamplingoptions are specified, onlyfloats as return value are allowed.- binning – If this parameter is set to an array-like object, we will integrate the function over the specified bins for every point in parameter space.
- sampling – If this parameter is set to an array-like object, we will apply the function to these points for every point in parameter space.
- normalize – If a binning is specified, normalize the resulting distribution.
- xvar – Name of variable on x-axis
- yvar – Name of variable on y-axis
- **kwargs – All other keyword arguments are passed to the function.
Returns: None
set_spoints_grid(values: Dict[str, Iterable[float]]) → None[source]¶Set a grid of points in sampling space.
Parameters: values – A dictionary of the following form:
{ <coeff name>: [ value_1, ..., value_n ] }where
value_1, …,value_ncan be complex numbers in general.
set_spoints_equidist(ranges: Dict[str, tuple]) → None[source]¶Set a list of ‘equidistant’ points in sampling space.
Parameters: ranges – A dictionary of the following form:
{ <coeff name>: ( <Minimum of coeff>, <Maximum of coeff>, <Number of bins between min and max>, ) }Note
In order to add imaginary parts to your coefficients, prepend their name with
im_(you can customize this prefix by setting theimaginary_prefixattribute to a custom value.)Example:
s = Scanner() s.set_spoints_equidist( { "a": (-2, 2, 4), "im_a": (-1, 1, 10), }, ... )Will sample the real part of
ain 4 points between -2 and 2 and the imaginary part ofain 10 points between -1 and 1.
Returns: None
add_spoints_noise(generator='gauss', **kwargs) → None[source]¶Add noise to existing sample points.
Parameters:
- generator – Random number generator. Default is
gauss. Currently supported:gauss.- **kwargs – Additional keywords to configure the generator. These keywords are as follows (value assignments are the default values):
gauss:mean = 0,sigma = 1
set_no_workers(no_workers: int) → None[source]¶Set the number of worker processes to be used. This will usually translate to the number of CPUs being used.
Parameters: no_workers – Number of worker processes Returns: None
set_imaginary_prefix(value: str) → None[source]¶Set prefix to be used for imaginary parameters in
set_spoints_grid()andset_spoints_equidist().
Parameters: value – Prefix string Returns: None
run(data: clusterking.data.data.Data) → Optional[clusterking.scan.scanner.ScannerResult][source]¶Calculate all sample points and writes the result to a dataframe.
Parameters: data – Data object. Returns: ScannerResultor NoneWarning
The function set in
set_dfunction()has to be a globally defined function in order to do multiprocessing, else you will probably run into the errorCan't pickle local object ...that is issued by the python multiprocessing module. If you run into any probelms like this, you can always run in single core mode by specifyingno_workes=1.
- class
clusterking.scan.ScannerResult(data: clusterking.data.data.Data, rows: List[List[float]], spoints, md, coeffs)[source]¶Bases:
clusterking.result.DataResult
imaginary_prefix¶Prefix for the name of imaginary parts of coefficients. Also see e.g.
set_spoints_equidist(). Read only.
spoints¶Points in parameter space that are sampled (read-only).
coeffs¶The name of the parameters/coefficients/dimensions of the spoints (read only). Set after spoints are set. Does not include the names of the columns of the imaginary parts.
WilsonScanner
- class
clusterking.scan.WilsonScanner(scale, eft, basis)[source]¶Bases:
clusterking.scan.scanner.ScannerScans the NP parameter space in a grid and also in the kinematic variable.
Usage example:
import flavio import functools import numpy as np import clusterking as ck # Initialize Scanner object s = ck.scan.WilsonScanner(scale=5, eft='WET', basis='flavio') # Sample 4 points for each of the 5 Wilson coefficients s.set_spoints_equidist( { "CVL_bctaunutau": (-1, 1, 4), "CSL_bctaunutau": (-1, 1, 4), "CT_bctaunutau": (-1, 1, 4) } ) # Set function and binning s.set_dfunction( functools.partial(flavio.np_prediction, "dBR/dq2(B+->Dtaunu)"), binning=np.linspace(3.15, 11.66, 10), normalize=True ) # Initialize a Data objects to write to d = ck.Data() # Run and write back data r = s.run(d) r.write()
__init__(scale, eft, basis)[source]¶Initializes the
clusterking.scan.WilsonScannerclass.
Parameters:
- scale – Wilson coeff input scale in GeV
- eft – Wilson coeff input eft
- basis – Wilson coeff input basis
Note
A list of applicable bases and EFTs can be found at https://wcxf.github.io/bases.html
scale¶Scale of the input wilson coefficients in GeV (read-only).
eft¶Wilson coefficient input EFT (read-only)
basis¶Wilson coefficient input basis (read-only)
Cluster
This subpackage provides classes to perform the actual clustering.
Different clustering algorithms correspond to different subclasses of the
base class clusterking.cluster.Cluster (and inherit all of its
methods).
Currently implemented:
HierarchyCluster: Hierarchical clustering (https://en.wikipedia.org/wiki/Hierarchical_clustering/)KmeansCluster: Kmeans clustering (https://en.wikipedia.org/wiki/K-means_clustering/)
Cluster
- class
clusterking.cluster.Cluster[source]¶Bases:
clusterking.worker.DataWorkerAbstract baseclass of the Cluster classes. This class is subclassed to implement specific clustering algorithms and defines common functions.
md= None¶Metadata
HierarchyCluster
- class
clusterking.cluster.HierarchyCluster[source]¶Bases:
clusterking.cluster.cluster.Cluster
max_d¶Cutoff value set in
set_max_d().
metric¶Metric that was set in
set_metric()(Function that takes Data object as only parameter and returns a reduced distance matrix.)
set_metric(*args, **kwargs) → None[source]¶Select a metric in one of the following ways:
- If no positional arguments are given, we choose the euclidean metric.
- If the first positional argument is string, we pick one of the metrics that are defined in
scipy.spatical.distance.pdistby that name (all additional arguments will be past to this function).- If the first positional argument is a function, we take this function (and add all additional arguments to it).
Examples:
...(): Euclidean metric...("euclidean"): Also Euclidean metric...(lambda data: scipy.spatial.distance.pdist(data.data(), 'euclidean'): Also Euclidean metric...("minkowski", p=2): Minkowsky distance withp=2.See https://docs.scipy.org/doc/scipy/reference/generated/scipy.spatial.distance.pdist.html for more information.
Parameters:
- *args – see description above
- **kwargs – see description above
Returns: Function that takes Data object as only parameter and returns a reduced distance matrix.
set_hierarchy_options(method='complete', optimal_ordering=False)[source]¶Configure hierarchy building
Parameters:
- method – See reference on
scipy.cluster.hierarchy.linkage- optimal_ordering – See reference on
scipy.cluster.hierarchy.linkage
set_max_d(max_d) → None[source]¶Set the cutoff value of the hierarchy that then gives the clusters. This corresponds to the
targument ofscipy.cluster.hierarchy.fcluster.
Parameters: max_d – float Returns: None
set_fcluster_options(**kwargs) → None[source]¶Set additional keyword options for our call to
scipy.cluster.hierarchy.fcluster.
Parameters: kwargs – Keyword arguments Returns: None
run(data, reuse_hierarchy_from: Optional[clusterking.cluster.hierarchy_cluster.HierarchyClusterResult] = None)[source]
Parameters:
- data –
- reuse_hierarchy_from – Reuse the hierarchy from a
HierarchyClusterResultobject.Returns:
- class
clusterking.cluster.HierarchyClusterResult(data, md, clusters, hierarchy, worker_id)[source]¶Bases:
clusterking.cluster.cluster.ClusterResult
hierarchy
worker_id¶ID of the HierarchyCluster worker that generated this object.
data_id¶ID of the data object that the HierarchyCluster worker was run on.
dendrogram(output: Union[None, str, pathlib.Path] = None, ax=None, show=False, **kwargs)[source]¶Creates dendrogram
Parameters:
- output – If supplied, we save the dendrogram there
- ax – An axes object if you want to add the dendrogram to an existing axes rather than creating a new one
- show – If true, the dendrogram is shown in a viewer.
- **kwargs – Additional keyword options to scipy.cluster.hierarchy.dendrogram
Returns: The matplotlib.pyplot.Axes object
KmeansCluster
- class
clusterking.cluster.KmeansCluster[source]¶Bases:
clusterking.cluster.cluster.ClusterKmeans clustering (wikipedia) as implemented in
sklearn.cluster.Example:
import clusterking as ck d = ck.Data("/path/to/data.sql") # Load some data c = ck.cluster.KmeansCluster() # Init worker class c.set_kmeans_options(n_clusters=5) # Set options for clustering r = c.run(d) # Perform clustering on data r.write() # Write results back to data
Benchmark
This module contains worker classes that select representative sample points for each cluster (“benchmark points”).
AbstractBenchmark
- class
clusterking.benchmark.AbstractBenchmark[source]¶Bases:
clusterking.worker.DataWorkerSubclass this class to implement algorithms to choose benchmark points from all the points (in parameter space) that correspond to one cluster.
cluster_column
Benchmark
- class
clusterking.benchmark.Benchmark[source]¶Bases:
clusterking.benchmark.abstract_benchmark.AbstractBenchmarkSelecting benchmarks based on a figure of merit that is calculated with the metric. You have to use
set_metric()to specify the metric (as for theHierarchyClusterclass). The default case for the figure of merit (“sum”) chooses the point as benchmark point that minimizes the sum of all distances to all other points in the same cluster (where “distance” of course is with respect to the metric).
set_metric(*args, **kwargs) → None[source]¶Select a metric in one of the following ways:
- If no positional arguments are given, we choose the euclidean metric.
- If the first positional argument is string, we pick one of the metrics that are defined in
scipy.spatical.distance.pdistby that name (all additional arguments will be past to this function).- If the first positional argument is a function, we take this function (and add all additional arguments to it).
Examples:
...(): Euclidean metric...("euclidean"): Also Euclidean metric...(lambda data: scipy.spatial.distance.pdist(data.data(), 'euclidean'): Also Euclidean metric...("minkowski", p=2): Minkowsky distance withp=2.See https://docs.scipy.org/doc/scipy/reference/generated/scipy.spatial.distance.pdist.html for more information.
Parameters:
- *args – see description above
- **kwargs – see description above
Returns: Function that takes Data object as only parameter and returns a reduced distance matrix.
set_fom(fct: Callable, *args, **kwargs) → None[source]¶Set a figure of merit. The default case for the figure of merit ( “sum”) chooses the point as benchmark point that minimizes the sum of all distances to all other points in the same cluster (where “distance” of course is with respect to the metric). In general we choose the point that minimizes
self.fom(<metric>), i.e. the default case corresponds toself.fom = lambda x: np.sum(x, axis=1), which you could have also set by callingself.set_com(np.sum, axis=1).
Parameters:
- fct – Function that takes the metric as first argument
- *args – Positional arguments that are added to the positional arguments of
fctafter the metric- **kwargs – Keyword arguments for the function
Returns: None
Stability
Investigate the stability of your clustering algorithm.
Stability Testers
-
class
clusterking.stability.stabilitytester.StabilityTesterResult[source]¶ Bases:
clusterking.result.AbstractResultResult of a
AbstractStabilityTester
-
class
clusterking.stability.stabilitytester.SimpleStabilityTesterResult(df: <sphinx.ext.autodoc.importer._MockObject object at 0x7f106a14a0f0>)[source]¶ Bases:
clusterking.result.AbstractResult-
classmethod
load(path: Union[str, pathlib.PurePath]) → clusterking.stability.stabilitytester.SimpleStabilityTesterResult[source]¶ Load
SimpleStabilityTesterResultfrom file.Parameters: path – Path to result file Returns: SimpleStabilityTesterResultobjectExample
sstr = SimpleStabilityTesterResult.load(“path/to/file”)
-
classmethod
-
class
clusterking.stability.stabilitytester.AbstractStabilityTester(exceptions='raise')[source]¶ Bases:
clusterking.worker.AbstractWorkerAbstract baseclass to perform stability tests. This baseclass is a subclass of
clusterking.worker.AbstractWorkerand thereby adheres to the Command design pattern: After initialization, several methods can be called to modify internal settings. Finally, therun()method is called to perform the actual test.All current stability tests perform the task at hand (clustering, benchmarking, etc.) for multiple, slightly varied datasets or worker parameters (these runs are called ‘experiments’). For each of these (for each experiment), figures of merit (FOMs) are calculated that compare the outcome with the original outcome (e.g. how many points still lie in the same cluster, or how far the benchmark points are diverging). These FOMs are then written out to a
StabilityTesterResultobject, which provides methods for visualization and further analyses (e.g. histograms, etc.).-
__init__(exceptions='raise')[source]¶ Initialize
AbstractStabilityTesterParameters: exceptions – When calculating the FOM, what should we do if an exception arises. ‘raise’: Raise exception, ‘print’: Return None and print exception information.
-
add_fom(fom: clusterking.stability.fom.FOM) → None[source]¶ Add a figure of merit (FOM).
Parameters: fom – FOMobjectReturns: None
-
run(*args, **kwargs) → clusterking.stability.stabilitytester.StabilityTesterResult[source]¶ Run the stability test.
Parameters: - *args – Positional arguments
- **kwargs – Key word arguments
Returns: StabilityTesterResultobject
-
-
class
clusterking.stability.noisysamplestability.NoisySampleStabilityTesterResult(df, samples=None, **kwargs)[source]¶ Bases:
clusterking.stability.stabilitytester.SimpleStabilityTesterResultResult of
NoisySampleStabilityTester-
samples= None¶ Collected samples
-
-
class
clusterking.stability.noisysamplestability.NoisySampleResult(samples: Optional[List[clusterking.data.data.Data]] = None)[source]¶ Bases:
clusterking.result.AbstractResult-
write(directory: Union[str, pathlib.PurePath], non_empty='add') → None[source]¶ Write to output directory
Parameters: - directory – Path to directory
- non_empty – What to do if directory is not empty:
raise(raiseFileExistsError),ignore(do nothing and potentially overwrite files),add(add files with new name).
Returns: None
-
classmethod
load(directory: Union[str, pathlib.PurePath], loader: Optional[Callable] = None) → clusterking.stability.noisysamplestability.NoisySampleResult[source]¶ Load from output directory
Parameters: - directory – Path to directory to load from
- loader – Function used to load data (optional).
Example:
def loader(path): d = clusterking.DataWithError(path) d.add_rel_err_uncorr(0.01) return d nsr = NoisySampleResult.load("/path/to/dir/", loader=loader)
-
-
class
clusterking.stability.noisysamplestability.NoisySample[source]¶ Bases:
clusterking.worker.AbstractWorkerThis stability test generates data samples with slightly varied sample points (by adding
clusterking.scan.Scanner.add_spoints_noise()to a pre-configuredclusterking.scan.Scannerobject)Example:
import clusterking as ck from clusterking.stability.noisysamplestability import NoisySample # Set up data object d = ck.Data() # Set up scanner s = Scanner() s.set_dfunction(...) s.set_spoints_equidist(...) # Set up noisysample object ns = NoisySample() ns.set_repeat(1) ns.set_noise("gauss", mean=0., sigma=1/30/4) # Run and write nsr = ns.run(scanner=s, data=d) nsr.write("output/folder")
-
set_repeat(repeat=10) → None[source]¶ Set number of experiments.
Parameters: repeat – Number of experiments Returns: None
-
set_noise(*args, **kwargs) → None[source]¶ Configure noise, applied to the spoints in each experiment. See
clusterking.scan.Scanner.add_spoints_noise().Parameters: - *args – Positional arguments to
clusterking.scan.Scanner.add_spoints_noise(). - **kwargs – Keyword argumnets to
clusterking.scan.Scanner.add_spoints_noise().
Returns: None
- *args – Positional arguments to
-
run(scanner: clusterking.scan.scanner.Scanner, data: Optional[clusterking.data.data.Data] = None) → clusterking.stability.noisysamplestability.NoisySampleResult[source]¶ Note
This method will handle keyboard interrupts and still return the so far collected data.
Parameters: - scanner –
Scannerobject - data – data:
Dataobject. This does not have to contain any actual sample points, but is used so that you can use data with errors by passing aDataWithErrorsobject.
Returns: - scanner –
-
-
class
clusterking.stability.noisysamplestability.NoisySampleStabilityTester(*args, keep_samples=False, **kwargs)[source]¶ Bases:
clusterking.stability.stabilitytester.AbstractStabilityTesterThis stability test generates data samples with slightly varied sample points (by adding
clusterking.scan.Scanner.add_spoints_noise()to a pre-configuredclusterking.scan.Scannerobject) and compares the resulting clusters and benchmark points.Example:
nsr = NoisySampleResult() nsr.load("/path/to/samples/") c = ck.cluster.HierarchyCluster() c.set_metric() c.set_max_d(0.2) nsst = NoisySampleStabilityTester() nsst.add_fom(DeltaNClusters(name="DeltaNClusters")) r = nsst.run(sample=nsr, cluster=c)
-
__init__(*args, keep_samples=False, **kwargs)[source]¶ Initialize
NoisySampleStabilityTesterParameters: - *args – Arguments passed on to
AbstractStabilityTester - keep_samples – Save clustered/benchmarked samples to
NoisySampleStabilityTester.samples - **kwargs – Keyword arguments passed on to
AbstractStabilityTester
- *args – Arguments passed on to
-
run(sample: clusterking.stability.noisysamplestability.NoisySampleResult, cluster: Optional[clusterking.cluster.cluster.Cluster] = None, benchmark: Optional[clusterking.benchmark.abstract_benchmark.AbstractBenchmark] = None) → clusterking.stability.noisysamplestability.NoisySampleStabilityTesterResult[source]¶ Run stability test.
Parameters: - sample –
NoisySampleResult - cluster –
Clusterobject - benchmark – Optional:
Clusterobject
Returns: - sample –
-
-
class
clusterking.stability.subsamplestability.SubSampleStabilityTesterResult(df: <sphinx.ext.autodoc.importer._MockObject object at 0x7f106a14a0f0>)[source]¶ Bases:
clusterking.stability.stabilitytester.SimpleStabilityTesterResult
-
class
clusterking.stability.subsamplestability.SubSampleStabilityTester[source]¶ Bases:
clusterking.stability.stabilitytester.AbstractStabilityTesterTest the stability of clustering algorithms by repeatedly clustering subsamples of data.
Example:
ssst = SubSampleStabilityTester() ssst.set_sampling(frac=0.99) ssst.set_repeat(50) d = ck.Data(path) c = ck.cluster.HierarchyCluster() c.set_metric("euclidean") c.set_max_d(0.2) c.run(data=d).write() b = Benchmark() b.set_metric("euclidean") b.run(data=d).write() ssstr = ssst.run(data=d, cluster=c, benchmark=b)
-
set_sampling(**kwargs) → None[source]¶ Configure the subsampling of the data. If performing benchmarking, it is ensured that none of the benchmark points of the original dataframe are removed during subsampling (to allow to compare the benchmarking results).
Parameters: **kwargs – Keyword arguments to clusterking.data.Data.sample_param_random(), in particular keyword arguments topandas.DataFrame.sample().Returns: None Example:
ssst.set_sampling(n=100) # Sample 100 points ssst.set_sampling(frac=0.9) # Sample 90% of the points
-
set_repeat(repeat=100) → None[source]¶ Parameters: repeat – Number of subsamples to test Returns: None
-
set_progress_bar(state=True) → None[source]¶ Set or unset progress bar.
Parameters: state – Bool: Display progress bar? Returns: None
-
-
class
clusterking.stability.subsamplestability.SubSampleStabilityVsFractionResult(df: <sphinx.ext.autodoc.importer._MockObject object at 0x7f106a14a0f0>)[source]¶ Bases:
clusterking.stability.stabilitytester.SimpleStabilityTesterResult
-
class
clusterking.stability.subsamplestability.SubSampleStabilityVsFraction[source]¶ Bases:
objectRepeatedly run
SubSampleStabilityTesterfor different fractions.
Figures of Merit
- class
clusterking.stability.fom.FOMResult(fom, name)[source]¶Bases:
clusterking.result.AbstractResultObject containing the result of a Figure of Merit (FOM), represented by a
FOMobject.
- class
clusterking.stability.fom.FOM(name: Optional[str] = None, preprocessor: Optional[clusterking.stability.preprocessor.Preprocessor] = None)[source]¶Bases:
clusterking.worker.AbstractWorkerFigure of Merit, comparing the outcome of two experiments (e.g. the clusters of two very similar datasets).
__init__(name: Optional[str] = None, preprocessor: Optional[clusterking.stability.preprocessor.Preprocessor] = None)[source]¶Initialize the FOM worker.
Parameters:
- name – Name of the FOM
- preprocessor –
Preprocessorobject
name¶Name of the FOM
preprocessor
- class
clusterking.stability.fom.CCFOM(name: Optional[str] = None, preprocessor: Optional[clusterking.stability.preprocessor.Preprocessor] = None)[source]¶Bases:
clusterking.stability.fom.FOMCluster Comparison figure of merit (CCFOM), comparing whether the clusters of two experiments match.
- class
clusterking.stability.fom.MatchingClusters(name: Optional[str] = None, preprocessor: Optional[clusterking.stability.preprocessor.Preprocessor] = None)[source]¶Bases:
clusterking.stability.fom.CCFOMFraction of sample points (spoints) that lie in the same cluster, when comparing two clustered datasets with the same number of sample points.
- class
clusterking.stability.fom.DeltaNClusters(name: Optional[str] = None, preprocessor: Optional[clusterking.stability.preprocessor.Preprocessor] = None)[source]¶Bases:
clusterking.stability.fom.CCFOMDifference of number of clusters between two experiments (number of clusters in experiment 1 - number of lcusters in experiment 2).
- class
clusterking.stability.fom.NClusters(which, **kwargs)[source]¶Bases:
clusterking.stability.fom.CCFOMNumber of clusters in dataset 1 or 2
- class
clusterking.stability.fom.BpointList(name: Optional[str] = None, preprocessor: Optional[clusterking.stability.preprocessor.Preprocessor] = None)[source]¶Bases:
clusterking.stability.fom.FOMAdds array of bpoint coordinates of data2
- class
clusterking.stability.fom.BMFOM(name: Optional[str] = None, preprocessor: Optional[clusterking.stability.preprocessor.Preprocessor] = None)[source]¶Bases:
clusterking.stability.fom.FOMAbstract class: Benchmark Figure of Merit (BMFOM), comparing whether the benchmark points of two experiments match.
- class
clusterking.stability.fom.AverageBMProximityFOM(*args, **kwargs)[source]¶Bases:
clusterking.stability.fom.BMFOMReturns the average distance of benchmark points in parameter space between two experiments.
named_averaging_fcts= dict_keys(['arithmetic', 'max'])
named_metric_fcts= dict_keys(['euclidean'])
__init__(*args, **kwargs)[source]¶Initialize the FOM worker.
:param See
__init__():
set_averaging(fct: Union[str, Callable]) → None[source]¶Set averaging mode
Parameters: fct – Function of the distances between benchmark points of the same cluster or name of pre-implemented functions (check named_averaging_fctsfor a list)Returns: None
set_metric(fct: Union[str, Callable]) → None[source]¶Set metric in parameter space
Parameters: fct – Function of a tuple of two points in parameter space or name of pre-implemented functions (check named_metric_fctsfor a list)Returns: None
Preprocessors
- class
clusterking.stability.preprocessor.Preprocessor(name=None)[source]¶Bases:
clusterking.worker.AbstractWorker
name
- class
clusterking.stability.preprocessor.ClusterMatcherResult(data1, data2, rename_dct)[source]¶Bases:
clusterking.stability.preprocessor.PreprocessorResult
- class
clusterking.stability.preprocessor.ClusterMatcher(*args, cluster_column='cluster', **kwargs)[source]¶Bases:
clusterking.stability.preprocessor.PreprocessorCluster names are arbitrary in general, i.e. when trying to compare two clustered datasets and trying to calculate a figure of merit, we have to match the names together. This is donen by this worker class.
- class
clusterking.stability.preprocessor.TrivialClusterMatcher(*args, cluster_column='cluster', **kwargs)[source]¶Bases:
clusterking.stability.preprocessor.ClusterMatcherThus subclass of
CCMatchermaps cluster names from the first clustering to the cluster name of the second that maximizes the number of sample points that lie in the same cluster. It also only returns the intersection of the indizes of both Series.
- class
clusterking.stability.preprocessor.FirstComeFirstServe1DClusterMatcher(*args, cluster_column='cluster', **kwargs)[source]¶Bases:
clusterking.stability.preprocessor.ClusterMatcherThis subclass of
CCMatcherworks only for 1D parameter spaces. It simply sorts the first points of each cluster and enumerates them in order to get a unique name for each cluster.
Plots
Implementation of different plots.
Note
Most plots are now directly available as methods of the data.Data,
e.g. plot_clusters_scatter() is equivalent to
cp = ClusterPlot(data)
cp.scatter()
Warning
These implementations are still subject to change in the near future, so
it is recommended to use the methods of the data.Data class as
advertised above.
ClusterPlot
- class
clusterking.plots.ClusterPlot(data)[source]¶Bases:
objectPlot clusters in parameter space.
After initialization, use the ‘scatter’ or ‘fill’ method for plotting.
You can modify the attributes of this class to tweak some properties of the plots.
log= None¶logging.Logger object
data= None¶Instance of pandas.DataFrame
color_scheme= None¶Color scheme
markers= None¶List of markers of the get_clusters (scatter plot only).
max_subplots= None¶Maximal number of subplots
max_cols= None¶Maximal number of columns of the subplot grid
kv_formatter= None¶Formatting of key-value pairs in title of plots
fig_base_size= None¶figure size of each subplot
aspect_ratio= None¶Automatically inferred
Type: Ratio of height/width. None
cluster_column= None¶The name of the column that holds the cluster index
bpoint_column= None¶The name of the column that holds the benchmark yes/no information
default_marker_size= None¶Default marker size
bpoint_marker_size= None¶Marker size of benchmark points
draw_legend= None¶If true, a legend is drawn
fig¶The figure.
figsize¶Figure size per subplot (width, height)
scatter(cols: List[str], clusters=None, **kwargs)[source]¶Create scatter plot, specifying the columns to be on the axes of the plot. If 3 column are specified, 3D scatter plots are presented, else 2D plots. If the dataframe contains more columns, such that each row is not only specified by the columns on the axes, a selection of subplots is created, showing ‘cuts’. Benchmark points are marked by enlarged plot markers.
Parameters:
- cols – The names of the columns to be shown on the x, y (and z) axis of the plots.
- clusters – The get_clusters to be plotted (default: all)
- **kwargs – Kwargs for ax.scatter
Returns: The figure (unless the ‘inline’ setting of matplotllib is detected).
fill(cols: List[str], kwargs_imshow=None)[source]¶Call this method with two column names, x and y. The results are similar to those of 2D scatter plots as created by the scatter method, except that the coloring is expanded to the whole xy plane. Note: This method only works with uniformly sampled NP!
Parameters:
- cols – List of name of column to be plotted on x-axis and on y-axis
- kwargs_imshow – Additional keyword arguments to be passed to imshow
Returns: The figure (unless the ‘inline’ setting of matplotllib is detected).
BundlePlot
- class
clusterking.plots.BundlePlot(data)[source]¶Bases:
objectPlotting class to plot distributions by cluster in order to analyse which distributions get assigned to which cluster.
log= None¶logging.Logger object
data= None¶pandas dataframe
cluster_column= None¶Name of the column holding the cluster number
draw_legend= None¶Draw legend?
title= None¶Override default titles with this title. If None, the default title is used.
ax= None¶Instance of matplotlib.axes.Axes
fig¶Instance of matplotlib.pyplot.figure
xrange¶Range of the xaxis
xlabel
ylabel
plot_bundles(clusters: Union[None, int, Iterable[int]] = None, nlines=None, ax=None, bpoints=True, hist_kwargs: Optional[Dict[str, Any]] = None, hist_kwargs_bp: Optional[Dict[str, Any]] = None) → None[source]¶Plot several examples of distributions for each cluster specified
Parameters:
- clusters – List of clusters to selected or single cluster. If None (default), all clusters are chosen.
- nlines – Number of example distributions of each cluster to be plotted. Defaults to 0 if we plot benchmark points and 3 otherwise.
- ax – Instance of matplotlib.axes.Axes to be plotted on. If None (default), a new axes object and figure is initialized and saved as self.ax and self.fig.
- bpoints – Draw benchmark curve
- hist_kwargs – Keyword arguments passed on to
plot_histogram()- hist_kwargs_bp – Like
hist_kwargsbut used for benchmark points. IfNone,hist_kwargsis used.Returns: None
plot_minmax(clusters: Union[int, Iterable[int], None] = None, ax=None, bpoints=True, hist_kwargs: Optional[Dict[str, Any]] = None, fill_kwargs: Optional[Dict[str, Any]] = None) → None[source]¶Plot the minimum and maximum of each bin for the specified clusters.
Parameters:
- clusters – List of clusters to selected or single cluster. If None (default), all clusters are chosen.
- ax – Instance of
matplotlib.axes.Axesto plot on. If None, a new one is instantiated.- bpoints – Plot benchmark points
- hist_kwargs – Keyword arguments to
plot_histogram()- fill_kwargs – Keyword arguments to`matplotlib.pyplot.fill_between`
Returns: None
err_plot(clusters: Union[None, int, Iterable[int]] = None, ax=None, bpoints=True, hist_kwargs: Optional[Dict[str, Any]] = None, hist_fill_kwargs: Optional[Dict[str, Any]] = None)[source]¶Plot distributions with errors.
Parameters:
- clusters – List of clusters to selected or single cluster. If None (default), all clusters are chosen.
- ax – Instance of matplotlib.axes.Axes to plot on. If None, a new one is instantiated.
- bpoints – Plot benchmark points? If False or benchmark points are not available, distributions correponding to random sample points are chosen.
- hist_kwargs – Keyword arguments to
plot_histogram()- hist_fill_kwargs – Keyword arguments to
plot_histogram_fill()Returns: None
box_plot(clusters: Union[int, Iterable[int], None] = None, ax=None, whiskers=2.5, bpoints=True, boxplot_kwargs: Optional[Dict[str, Any]] = None, hist_kwargs: Optional[Dict[str, Any]] = None) → None[source]¶Box plot of the bin contents of the distributions corresponding to selected clusters.
Parameters:
- clusters – List of clusters to selected or single cluster. If None (default), all clusters are chosen.
- ax – Instance of matplotlib.axes.Axes to plot on. If None, a new one is instantiated.
- whiskers – Length of the whiskers of the box plot in units of IQR (interquartile range, containing 50% of all values). Default 2.5.
- bpoints – Draw benchmarks?
- boxplot_kwargs – Arguments to matplotlib.pyplot.boxplot
- hist_kwargs – Keyword arguments to
plot_histogram()
plot_histogram
clusterking.plots.plot_histogram(ax, edges, contents, normalize=False, **kwargs)[source]¶Plot a histogram.
Parameters:
- ax – Instance of matplotlib.axes.Axes to plot on. If
None, a new figure will be initialized.- edges – Edges of the bins or None (to use bin numbers on the x axis)
- contents – bin contents
- normalize (bool) – Normalize histogram. Default False.
- **kwargs – passed on to matplotlib.pyplot.step
Returns: Instance of matplotlib.axes.Axes
Colors
- class
clusterking.plots.ColorScheme(clusters: Optional[List[int]] = None, colors: Optional[List[str]] = None)[source]¶Bases:
objectClass holding color scheme. We want to assign a unique color to every cluster and keep it consistent accross different plots. Subclass and overwrite color lists to implement different schemes.
__init__(clusters: Optional[List[int]] = None, colors: Optional[List[str]] = None)[source]¶Initialize ColorScheme object.
Parameters:
- clusters – List of cluster names
- colors – List of colors
cluster_colors¶List of colors
get_cluster_color(cluster: int)[source]¶Returns base color for cluster.
Parameters: cluster – Name of cluster. Has to be in clustersReturns: Color
faded_colormap(cluster: int, nlines: int, name='MyFadedColorMap', **kwargs)[source]¶Returns colormap for one cluster, including the faded colors.
Parameters:
- cluster – Name of cluster
- nlines – Number of shades
- name – Name of colormap
- **kwargs – Arguments for
get_cluster_colors_faded()Returns: Colormap
demo_faded(cluster: Optional[int] = None, nlines=10, **kwargs)[source]¶Plot the color shades for different lines corresponding to the same cluster
Parameters:
- cluster – Name of cluster
- nlines – Number of shades
- **kwargs – Arguments for
get_cluster_colors_faded()Returns: figure
get_cluster_colors_faded(cluster: int, nlines: int, max_alpha=0.7, min_alpha=0.3)[source]¶Shades of the base color, for cases where we want to draw multiple lines for one cluster
Parameters:
- cluster – Name of cluster
- nlines – Number of shades
- max_alpha – Maximum alpha value
- min_alpha – Minimum alpha value
Returns: List of colors
Maths
Mathematics.
Binning
clusterking.maths.binning.bin_function(fct, binning: numpy.array, normalize=False) → numpy.array[source]¶Bin function, i.e. calculate the integrals of a function for each bin.
Parameters:
- fct – Function to be integrated per bin
- binning – Array of bin edge points.
- normalize – If true, we will normalize the distribution, i.e. divide by the sum of all bins in the end.
Returns: Array of bin contents
Metric
clusterking.maths.metric.chi2(n1: numpy.ndarray, n2: numpy.ndarray, cov1: numpy.ndarray, cov2: numpy.ndarray, normalize=False) → numpy.ndarray[source]
Parameters:
- n1 – n_obs x n_bins
- n2 – Either n_obs x n_bins or just nbins if we’re testing against a constant histogram
- cov1 – Either n_obs x n_bins x n_bins or n_bins x n_bins
- cov2 – Either n_obs x n_bins x n_bins or n_bins x n_bins
- normalize –
Returns: n_obs vector of chi2 test results (degrees of freedom not yet divided out)
clusterking.maths.metric.chi2_metric(dwe: clusterking.data.dwe.DataWithErrors, output='condensed')[source]¶Returns the chi2/ndf values of the comparison of a datasets.
Parameters:
- dwe –
clusterking.data.dwe.DataWithErrorsobject- output – ‘condensed’ (condensed distance matrix) or ‘full’ (full distance matrix)
Returns: Condensed distance matrix or full distance matrix
Statistics
clusterking.maths.statistics.cov2err(cov)[source]¶Convert covariance matrix (or array of covariance matrices of equal shape) to error array (or array thereof).
Parameters: cov – [n x ] nbins x nbins array
- Returns
- [n x ] nbins array
clusterking.maths.statistics.cov2corr(cov)[source]¶Convert covariance matrix (or array of covariance matrices of equal shape) to correlation matrix (or array thereof).
Parameters: cov – [n x ] nbins x nbins array
- Returns
- [n x ] nbins x nbins array
clusterking.maths.statistics.corr2cov(corr, err)[source]¶Convert correlation matrix (or array of covariance matrices of equal shape) together with error array (or array thereof) to covariance matrix (or array thereof).
Parameters:
- corr – [n x ] nbins x nbins array
- err – [n x ] nbins array
- Returns
- [n x ] nbins x nbins array
Utility
This module bundles mostly technical utilities that might not be all this interesting for users.
Interface
Utils for the command line interface (CLI).
clusterking.util.cli.yn_prompt(question: str, yes=None, no=None) → bool[source]¶Ask yes-no question.
Parameters:
- question – Description of the prompt
- yes – List of strings interpreted as yes
- no – List of strings interpreted as no
Returns: True if yes, False if no.
clusterking.util.cli.handle_overwrite(paths, behavior, log)[source]¶Do we want to overwrite a file that exists?
Parameters:
- paths – List of pathlib.Paths
- behavior – How to proceed if output file already exists: ‘ask’, ‘overwrite’, ‘raise’
- log – logging.Logger instance
Returns: True if overwrite will occurr, False otherwise.
Log
Defines an easy function to set up a logger.
clusterking.util.log.get_logger(name='Logger', level=30, sh_level=30)[source]¶Sets up a logging.Logger.
If the colorlog module is available, the logger will use colors, otherwise it will be in b/w. The colorlog module is available at https://github.com/borntyping/python-colorlog but can also easily be installed with e.g. ‘sudo pip3 colorlog’ or similar commands.
Parameters:
- name – name of the logger
- level – General logging level
- sh_level – Logging level of stream handler
Returns: Logger
Metadata
Miscellaneous utilities
clusterking.util.metadata.nested_dict()[source]¶This is very clever and stolen from https://stackoverflow.com/questions/16724788/ Use it to initialize a dictionary-like object which automatically adds levels. E.g.
a = nested_dict() a['test']['this']['is']['working'] = "yaaay"
clusterking.util.metadata.turn_into_nested_dict(nested)[source]¶Turn a dictionary of dictionaries into a nested_dict default dict.
clusterking.util.metadata.get_git_info(log=None, path=None)[source]¶Return dictionary containing status of the git repository (commit hash, date etc.
Parameters:
- log – logging.Logger object (optional)
- path – path to .git subfolder or search path (optional)
Returns: dictionary
clusterking.util.metadata.save_git_info(output_path=None, *args, **kwargs) → Dict[str, str][source]¶Save output of git_info to a file.
Parameters:
- output_path – Output path. If None, the default will be bclustering/git_info.json
- *args – Passed on to git_info
- **kwargs – Passed on to git_info
Returns: Output of git_info
clusterking.util.metadata.load_git_info(input_path=None) → Dict[str, str][source]¶Load previously saved output of git_info from a json file.
Parameters: input_path – Input path to json file. If None, the default will be bclustering/git_info.json Returns: Parsed json file (should be identical to saved output of version_info).
Testing
clusterking.util.testing.set_testing_mode(testing_mode: bool) → None[source]¶Set an environment variable signalling if we are in testing mode.
Parameters: testing_mode (bool) – True if we are in testing mode Returns: None