Readme
Contents
Readme#
Description#
This package provides a flexible yet easy to use framework to cluster sets of histograms (or other higher dimensional data) and to select benchmark points representing each cluster. The package particularly focuses on use cases in high energy physics.
A physics use case has been demonstrated in JEHP (arXiv, doi).
Physics Case#
While most of this package is very general and can be applied to a broad variety of use cases, we have been focusing on applications in high energy physics (particle physics) so far and provide additional convenience methods for this use case. In particular, most of the current tutorials are in this context.
Though very successful, the Standard Model of Particle Physics is believed to be incomplete, prompting the search for New Physics (NP). The phenomenology of NP models typically depends on a number of free parameters, sometimes strongly influencing the shape of distributions of kinematic variables. Besides being an obvious challenge when presenting exclusion limits on such models, this also is an issue for experimental analyses that need to make assumptions on kinematic distributions in order to extract features of interest, but still want to publish their results in a very general way.
By clustering the NP parameter space based on a metric that quantifies the similarity of the resulting kinematic distributions, a small number of NP benchmark points can be chosen in such a way that they can together represent the whole parameter space. Experiments (and theorists) can then report exclusion limits and measurements for these benchmark points without sacrificing generality.
Installation#
clusterking can be installed/upgraded with the python package installer:
pip3 install --user --upgrade "clusterking[plotting]"
If you do not require plotting, you can remove [plotting].
More options and troubleshooting advice is given in the documentation.
Caveats#
Version 1.0.0 contained mistakes in the implementation of the chi2 metric. Please make sure that you are at least using version 1.1.0.
Usage and Documentation#
Good starting point: Jupyter notebooks in the examples/jupyter_notebook directory.
You can also try running them online right now (without any installation required) using
binder (just note that this is somewhat unstable, slow and takes some time
to start up).
For a documentation of the classes and functions in this package, read the docs on readthedocs.io.
For additional examples, presentations and more, you can also head to our other repositories.
Three steps#
The clustering workflow usually contains three steps:
Scanning: Kinematic distributions are generated for each point in the parameter space
Clustering: The parameter points that correspond to “similar” kinematic distributions are clustered together
Benchmarking: For each cluster, one parameter point is picked as “most representative” point based on the similarity of the kinematic distributions
This is illustrated in the following picture:
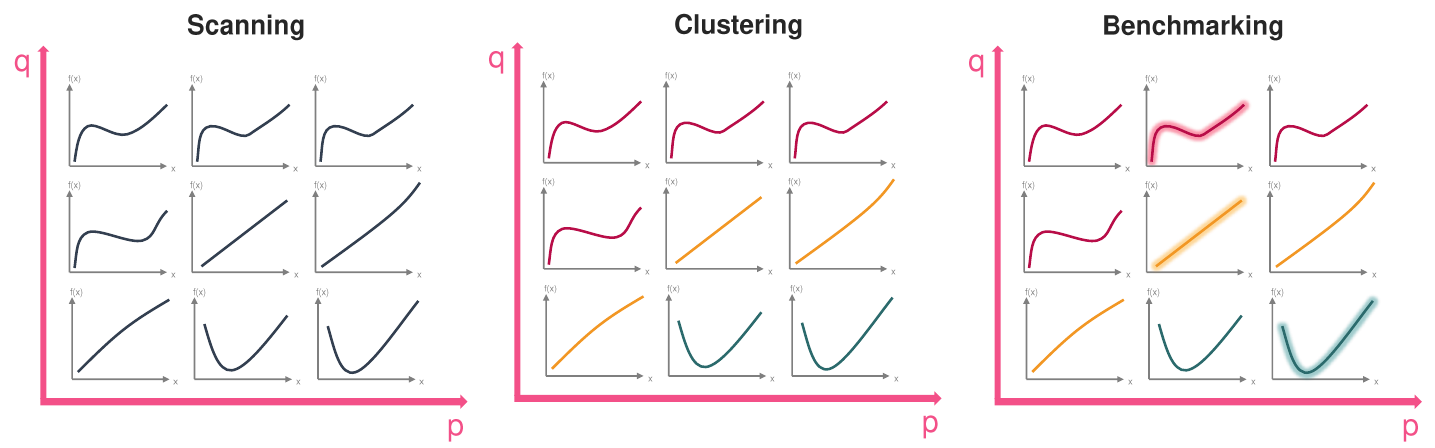
Let’s walk through the three steps:
Scanning: We have a two dimensional parameter space with parameters
pandq. Taking three values each, we get a grid of nine different(p, q)points. For each of these points in the parameter space, we generate the corresponding kinematic distribution.Clustering: We can see that there are three different “types” of kinematic distributions. The “squiggly ones” (red), the “straight ones” (yellow) and the “parabola like ones” (green). We expect that the specimen of each type get put in the same cluster.
Benchmarking: Finally one of the parameter points/kinematic distributions from each cluster is chosen as representative one. For the yellow cluster, there is a completely straight line, one that slightly curves downward and one that slightly curves upward. One might argue that the completely straight line is most representative because it minimizes e.g. the sum of distances (or the maximum distance) to the other two.
Example#
Sample#
The following code (taken from examples/jupyter_notebook/010_basic_tutorial.ipynb) is all that
is needed to cluster the shape of the q^2 distribution of B -> D tau nu
in the space of Wilson coefficients:
import flavio
import numpy as np
import clusterking as ck

s = ck.scan.WilsonScanner(scale=5, eft='WET', basis='flavio')

# Set up kinematic function

def dBrdq2(w, q):
    return flavio.np_prediction("dBR/dq2(B+->Dtaunu)", w, q)

s.set_dfunction(
    dBrdq2,
    binning=np.linspace(3.2, 11.6, 10),
    normalize=True
)

# Set sampling points in Wilson space

s.set_spoints_equidist({
    "CVL_bctaunutau": (-1, 1, 10),
    "CSL_bctaunutau": (-1, 1, 10),
    "CT_bctaunutau": (-1, 1, 10)
})

# Create data object to write to and run

d = ck.DataWithErrors()
r = s.run(d)
r.write()  # Write results back to data object
Cluster#
Using hierarchical clustering:
c = ck.cluster.HierarchyCluster()  # Initialize worker class
c.set_metric("euclidean")
c.set_max_d(0.15)      # "Cut off" value for hierarchy
r = c.run(d)           # Run clustering on d
r.write()              # Write results to d
Benchmark points#
b = ck.Benchmark() # Initialize worker class
b.set_metric("euclidean")
r = b.run(d)        # Select benchmark points based on metric
r.write()           # Write results back to d
Plotting#
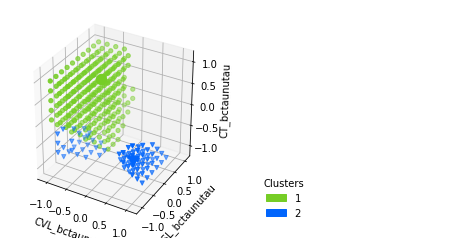
d.plot_clusters_scatter(
    ['CVL_bctaunutau', 'CSL_bctaunutau', 'CT_bctaunutau'],
    clusters=[1,2]  # Only plot 2 clusters for better visibility
)
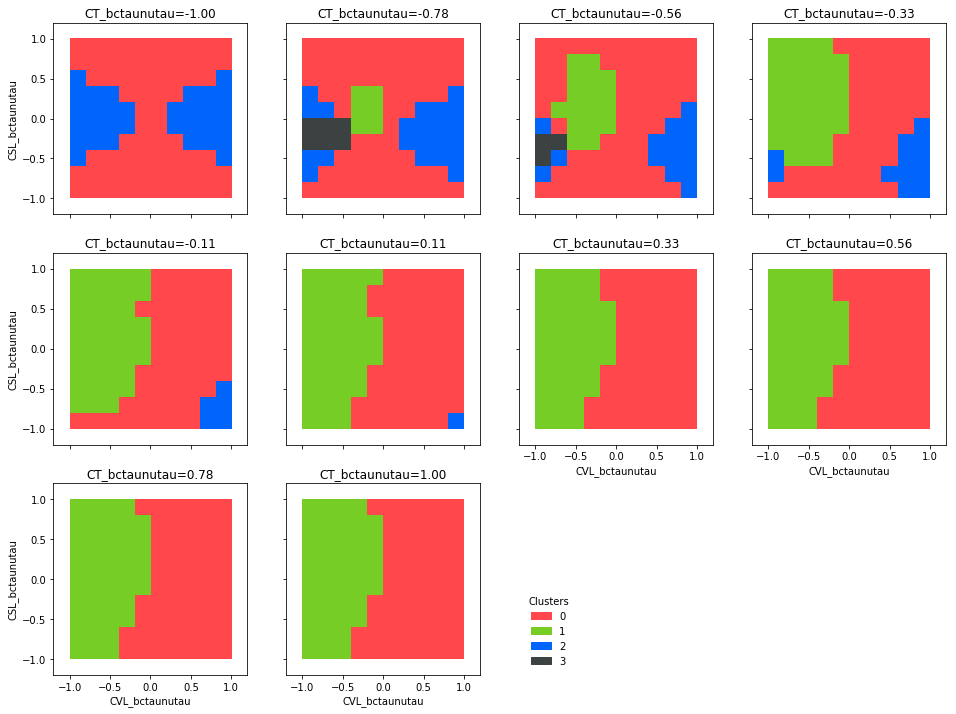
d.plot_clusters_fill(['CVL_bctaunutau', 'CSL_bctaunutau'])
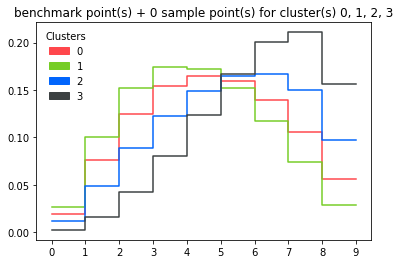
Plotting all benchmark points:
d.plot_dist()
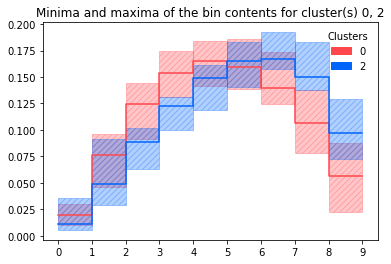
Plotting minima and maxima of bin contents for all histograms in a cluster (+benchmark histogram):
d.plot_dist_minmax(clusters=[0, 2])
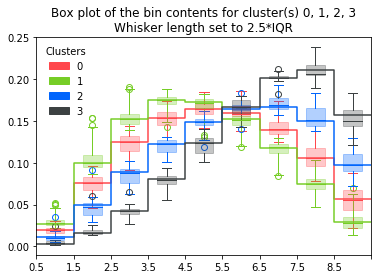
Similarly with box plots:
d.plot_dist_box()
License & Contributing#
This project is ongoing work and questions, comments, bug reports or pull requests are most welcome. You can also use the chat room on gitter or contact us via email. Please cite our paper when you are using our software.
This software is licenced under the MIT license.